
All your company's data in one datalake. With BI and AI agents on top.
Connect databases, spreadsheets, systems, CRMs and marketing platforms. ingestia.io builds and governs your datalake — Bronze, Silver and Gold layers — and, on that same data, delivers full BI and AI agents to analyze your company.
First the datalake, then BI, then AI agents — from source to decision, without building an entire data team.
Sources
ingestia.io
Pipelines · Bronze/Silver/Gold · Semantic model · Governance
Decision
From source to decision, in four steps
The same sequence you'll follow in the product: connect the source, build the pipeline, track the run and read the result in BI.
Connect sources
Register databases, spreadsheets, ERPs and marketing platforms. The connection is tested and reused by pipelines — registering it doesn't start any load.
Build pipelines
Define the load and publish version 1. The schedule starts off: running now and turning on the schedule are separate decisions.
Track runs
From run to task, from task to attempt, from attempt to log — with explicit time and time zone, and recovery with a declared scope.
Explore results
Dashboards, filters, measures and publishing on data that's already organized and governed — plus questions in natural language.
The shipped interface, in four stages
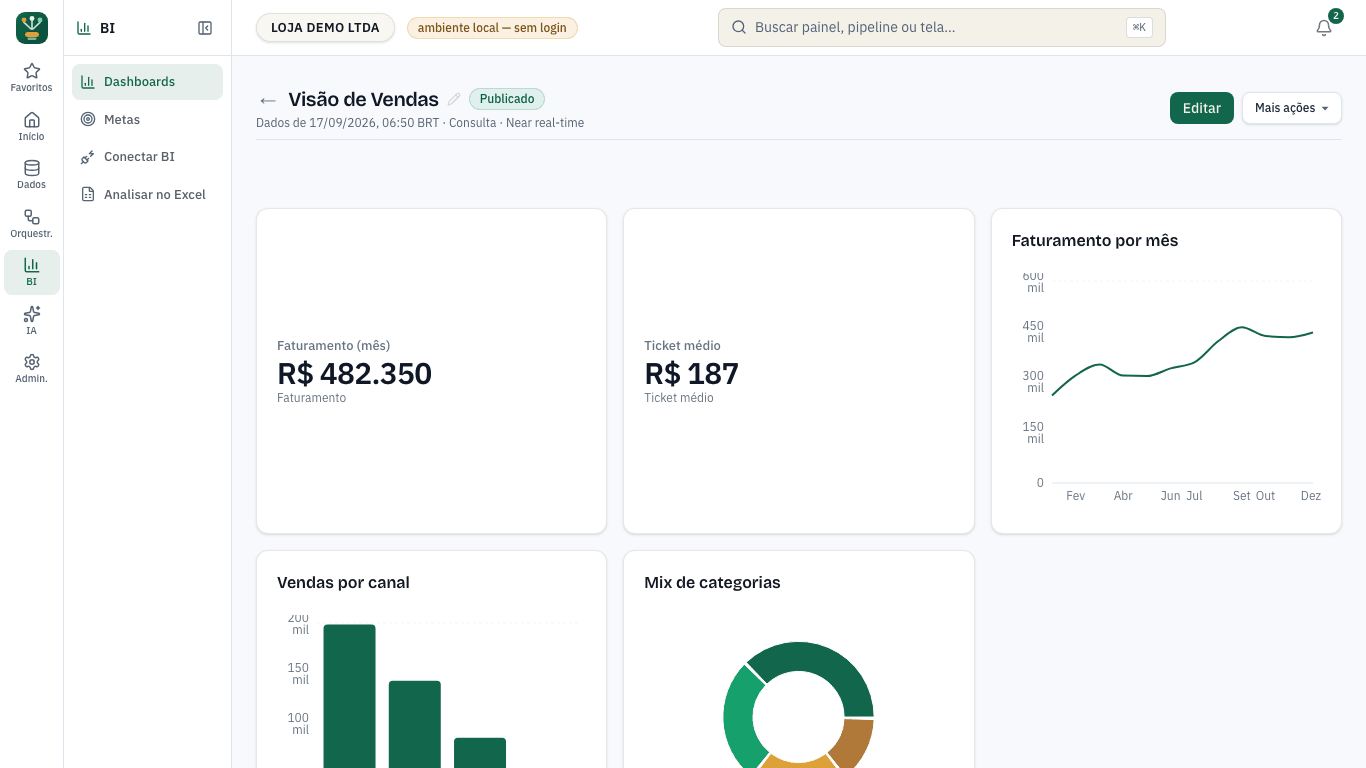
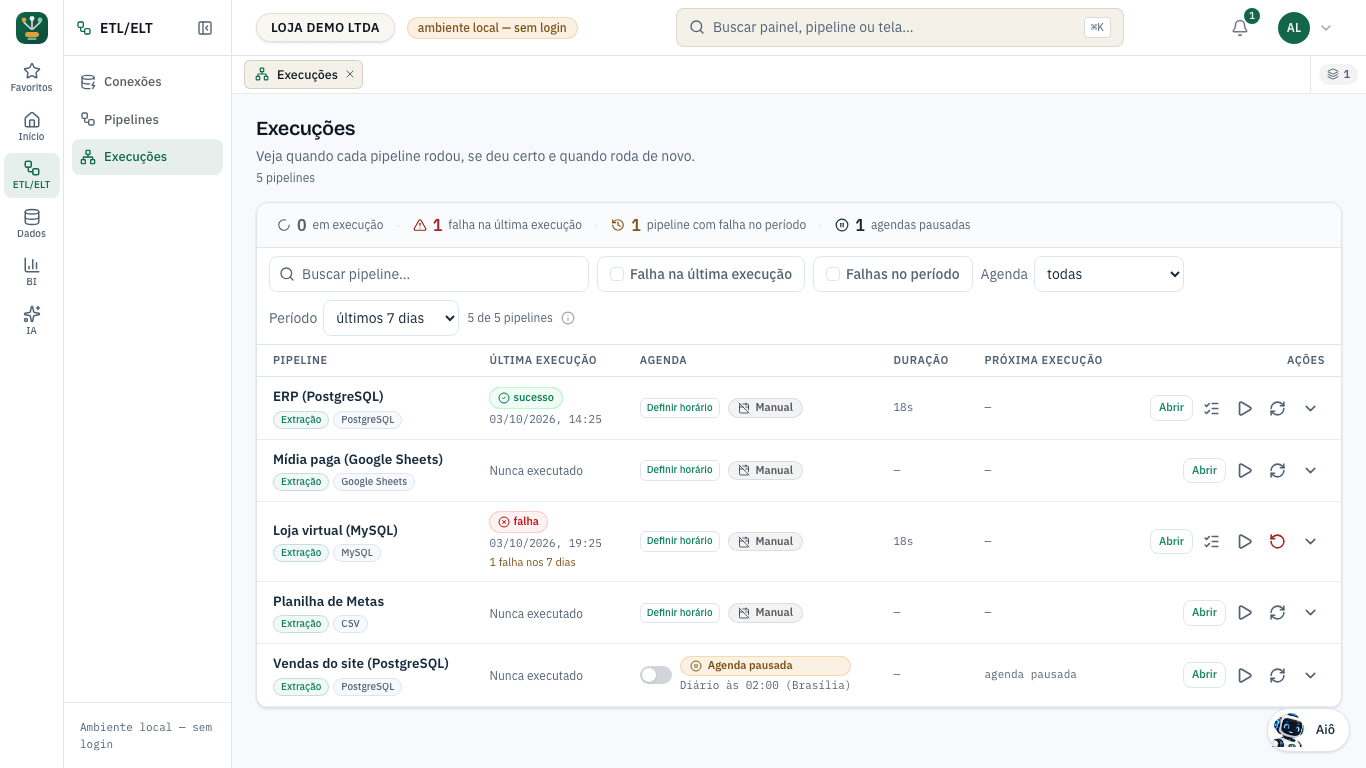
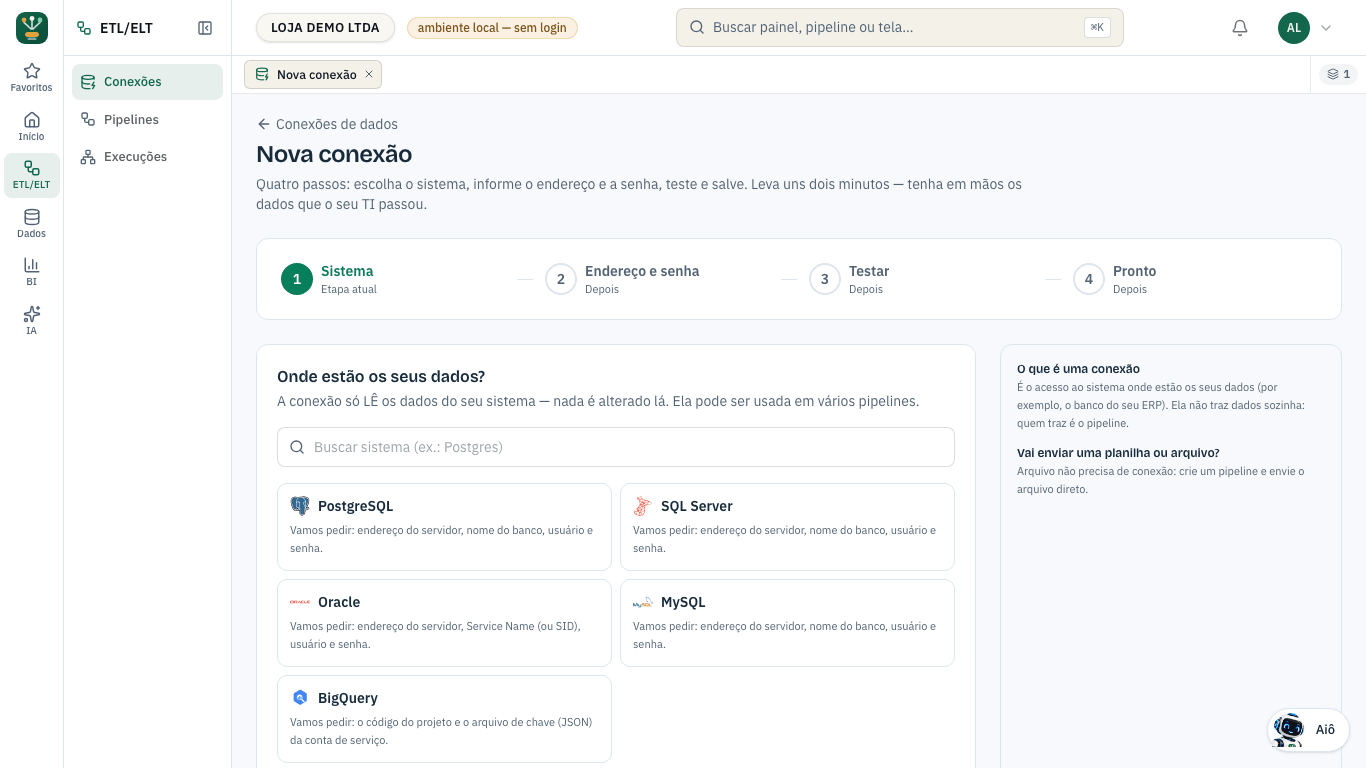
Screenshots of the published version, in a demo environment with fictitious data. Each image states the route it came from; zoom in with a click or the keyboard.
Product screenshots from a demo environment, with fictitious data. Screenshot of the shipped version, route /conexoes, in a local demo environment (documents the interface; does not prove cloud execution). Entry DOC-07 in the screenshot manifest.
Your data is scattered. Your decisions don't have to be.
If every report in your company needs five spreadsheets, you have a data problem. Isolated ERP, CRM, finance, marketing and spreadsheets make each team see a different version of the information.
Data in systems that don't talk to each other
ERP, CRM, finance and databases in silos. Each team sees a different version of the information.
Manual reports in spreadsheets
Every analysis turns into a puzzle of copying, pasting and cross-checking spreadsheets by hand.
Dashboards with inconsistent numbers
When data is scattered, every report shows a different total.
Dependence on technical people
Whenever someone needs new data, they depend on whoever knows how to put it all together.
A separate tool for everything
One to integrate, another to store, another for BI, another for AI. Each with its own license and learning curve.
Fear of unpredictable cloud costs
A bill that changes on its own is scary. You never know how much you'll spend by the end of the month.
ingestia.io brings it all together in one place: we connect the sources, organize the data, build your dashboards and the AI starts answering questions about the company.
Not sure what data structure your company needs?
Take the Data Structure Simulator and find out whether your company should start with simple centralization, automated pipelines, BI, governance or a more advanced structure.
From source to decision in one platform
Ingestia Data organizes, ingestia.bi shows and Ingestia AI answers — on the same governed data. Connect → Organize → Model → Visualize → Ask the AI.
Connect a source
Pick a compatible source, set up access and validate the connection before using it in processing.
Ingestia DataSee the guidePrepare the pipeline
Define the data, the transformations and the destination; review how the load will run and when.
Ingestia DataSee the guideTrack the run
See the status of each task, check the logs and find the spot that needs attention.
Ingestia DataSee the guideBuild the dashboard
Pick the prepared data, arrange your KPIs and apply the filters that help you understand the business.
ingestia.biSee the guideExplore with AI
Ask questions about the data you're allowed to see and check the basis of every answer. It isn't required to finish the BI journey.
Ingestia AISee the guideIngestia Data
The data platform: connectors, scheduled pipelines and Bronze, Silver and Gold layers.
See the moduleingestia.bi
Native BI: 46 data visuals, semantic model, Brazil maps and row-level security.
See the moduleIngestia AI
The AI analyst on governed data — with citations and answer provenance.
See the moduleIt's a single platform: one pipeline (no exporting data between tools), one central semantic model, one governance layer, one credit balance and one isolated tenant per customer. The Gold that Ingestia Data produces is the same one ingestia.bi charts and Ingestia AI queries.
Statuses used on this page: Available · Limited access · Planned.
Automated pipelines and Bronze, Silver and Gold layers
Your dashboard shouldn't depend on someone copying and pasting data every Monday. ingestia.io extracts, transforms and organizes the data on its own, on the schedule you set.
Run scheduling
Set when each flow runs — from hourly to once a day.
Chained steps
Build extraction, transformation and loading as connected steps.
Run history
Follow every run, with duration, rows and status.
Failure monitoring
See where it stopped and why, without hunting through logs.
Usage control
Know how much each pipeline costs in processing.
Usage alerts
Get warnings about unusual usage.
Raw data, stored exactly as it arrived from the source.
Processed data: cleaned, standardized and ready for analysis.
Data modeled for dashboards, KPIs, reports and AI.
Limited accessCloud execution depends on provisioning your workspace's environment, done with support from our team.
From data to dashboard without leaving the platform
Full BI built into your data platform: dashboards, KPIs, matrices, filters, drill, maps, semantic model, RLS, alerts, exports and embed.
Complete dashboards
KPIs, series, bars, maps, funnels, matrices and dozens of other visuals.
Matrix and pivot tables
Rows, columns, totals and subtotals — just like you build them in Excel.
Filters and drill
Filter by period, region or category and drill down to detail in one click.
Semantic model
Measures, context-aware formulas, targets and centralized business rules.
Brazil maps
Choropleth by state and municipality, layers and heat maps.
Row-level security (RLS)
Each person sees only the data they're allowed to see — on the same dashboard.
Metric alerts
Automatic warnings when a KPI goes off track.
Exports and embed
Export to Excel, plus PDF, PPTX and embedding in other systems.
46 data visuals + 4 layout elements — from KPI and matrix to maps, sankey, pareto and waterfall.
Full BI without licensing everyone in the company as a creator user. Creators pay the creator license (R$ 59/mo per additional person); view-only users come in packs starting at R$ 79/mo for 25 people.
Already use Power BI? Keep using it.
Data prepared by ingestia.io can be consumed where your team already works: Excel, Power BI, Looker Studio, Tableau, APIs and OData — over a read-only, scoped and auditable connection.
Power BI
Limited accessReads the prepared datasets via OData/API.
Excel
Limited accessReads the prepared datasets right inside the spreadsheet.
Looker Studio
Limited accessGoogle reports on the prepared datasets.
Tableau
Limited accessRead connection over the prepared layer.
APIs
Limited accessScoped read access to the layers via API.
Service Accounts
AvailableScoped access for machines and integrations.
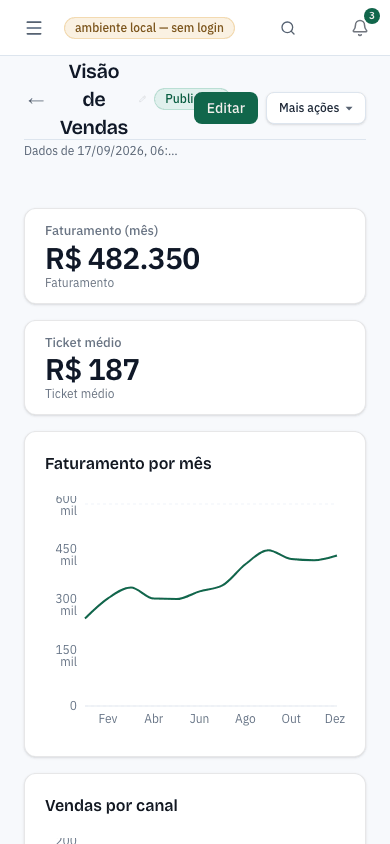
Viewing on a phone is part of the delivery. KPIs stack, filters stay within reach and reading needs no horizontal scrolling. The screenshot above came from the same demo dashboard as the gallery, at a 390 × 844 viewport — same version, same fixture.
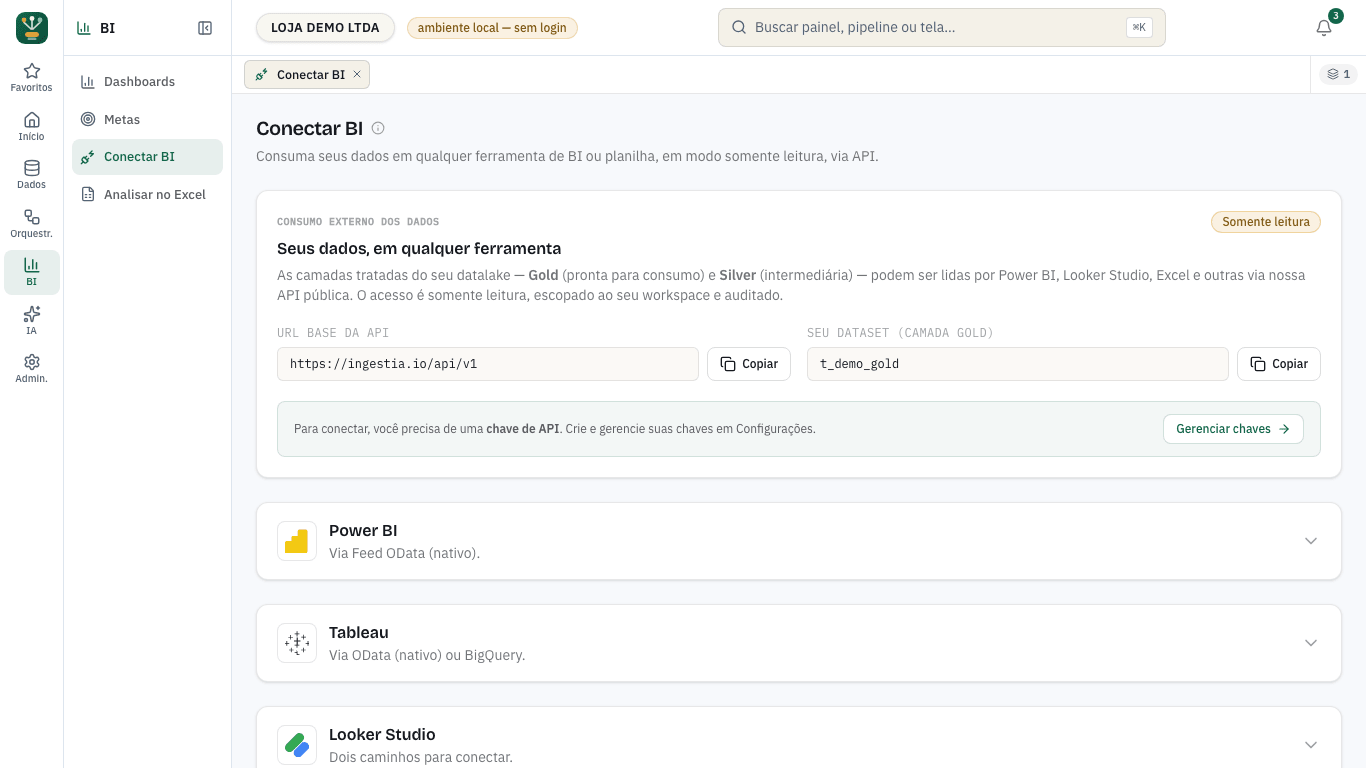
Limited access: Reading via OData/API works for experimentation. Certification with Power BI Desktop is still in progress and is enabled case by case. Each tool has a page with what has been validated. See the integrations →
Stop asking five people. Ask the data.
ingestia.io's AI works on your company's already organized and governed data — and answers with numbers, charts and citations, and declines when there's no basis.
Example questions
Behind the scenes: the AI understands the question, queries the organized data (with a cost limit and permissions respected) and returns the answer with the chart and where the number came from.
Ask your data
Your question in plain language becomes a query, and the answer comes with the number, the chart and the query used.
AI Analyst
Executive reports built by AI and scheduled, from the Growth plan up.
Anomalies and forecast
Detection of behavior outside the historical pattern and trend forecasting (correlation is not causation).
KPI alerts
A warning when a tracked KPI leaves its expected range.
Ask your data on any plan; the AI Analyst comes in from Growth up. AI usage is metered with a monthly cap per workspace, and the generated queries use platform credits — you see the cost, with no per-user license. Limited access: Human review of answer quality is still in progress; every answer includes the query and where the number came from, so you can check it.
What you won't find in a BI-only tool
Five things that, together, no standalone tool delivers — and that you'd have to assemble with several purchases and a team.
A single platform in your language
Integration, warehouse, BI and AI in one platform — without tying five tools together or building a data team.
BI without licensing every person
Creators pay the creator license (R$ 59/mo); view-only users cost almost nothing (+25 for R$ 79/mo).
Formulas in Portuguese, with English aliases
Over 100 spreadsheet-style functions — Portuguese names, with English aliases — translated into queries on your datalake.
AI on governed data
The AI shows where the number came from, respects permissions and row-level security, and has a cost cap per workspace — no per-user license.
Cost under control
A single credit balance for processing, storage, data movement and AI. You track usage and get a warning when the balance runs low.
Credentials by reference
The pipeline definition uses a reference to the credential, not the password. It's resolved at run time, with versioning, revocation and usage logging.
Data in Brazil + your own cloud (BYOC)
Processing in the São Paulo region, one dataset per customer. Run it in your own GCP account with an encrypted key (Business add-on R$ 990/mo; included in Scale+). The keyless variant is Planned.
Talk to us about BYOCConnect your main data sources
Databases, spreadsheets, ERPs, CRMs, marketing platforms and cloud storage — in one centralized environment, ready for analysis.
Databases
Direct, scheduled and scoped connections.
Spreadsheets and files
Send files to your environment and standardize the load.
Marketing and CRM
Campaigns, leads and sales alongside the rest of the company.
Cloud storage
Files sent to your environment's landing area.
- Available
- Usable today, in the product's normal flow.
- Limited access
- Exists, under the condition described on this page.
- Planned
- Not delivered yet — can't be used today.
What “Available” means here: you can register and use it today, in the product's normal flow, with your source's credential. It is not a general-availability statement: the product doesn't yet have a public SLA or a cloud certification, and the cloud bill for each run isn't published as a measured number.
Each connector opens a page with its status and conditions of use. Without a connector, files can be sent to your environment's landing area and follow the same layers, BI and AI flow. See the full connector catalog →
Security and isolation at every layer
From the source connection to the published dashboard, every access is controlled, scoped and auditable. Data governance isn't a separate project — it's part of the structure.
Data in the São Paulo region
Processing and storage in Brazil.
Per-user access control
Each person sees only what they need.
Granular permissions
Control over sources, datasets, dashboards and queries.
Sensitive data governance
Features that support LGPD (Brazil's data protection law) best practices and PII tagging.
Service Accounts
Secure consumption by machines and integrations.
Controlled APIs and webhooks
Read-only, scoped and auditable access.
Per-customer separation
Each company's data is kept isolated, with one dataset and one bucket per tenant.
Your own cloud (BYOC)
On Business and Scale, the datalake can run in your company's cloud.
Sensitive data (PII)
Tagging and protection of sensitive fields, with group-based access control.
Data lineage
Where each number came from: trace the origin column by column.
Auditing
Who accessed, queried and changed what — all logged.
Access control
Permissions by user, team and table; row- and column-level security.
Architecture implemented and covered by tests; validating isolation in the cloud (real IAM) is a pilot stage. Each company's data is isolated per tenant, with one dataset and one bucket per customer.
One platform instead of five purchases and a team
Why not build it yourself, or just use Power BI? Because ingestia.io delivers the integrated whole — not loose pieces for you to tie together.
Build it yourself
Several tools + a team
- Source integration You build it
- Pipelines and layers (Bronze/Silver/Gold) You build it
- Central semantic model You build it
- Native BI You build it
- AI on governed data You build it
- Governance and row-level security (RLS) You build it
- Predictable cost through credits No
- Everything in your language You build it
- Data in Brazil (São Paulo region) You build it
BI only
Power BI / Looker
- Source integration Partial
- Pipelines and layers (Bronze/Silver/Gold) No
- Central semantic model Integrated
- Native BI Integrated
- AI on governed data Partial
- Governance and row-level security (RLS) Partial
- Predictable cost through credits Partial
- Everything in your language Partial
- Data in Brazil (São Paulo region) Partial
ingestia.io
One integrated platform
- Source integration Integrated
- Pipelines and layers (Bronze/Silver/Gold) Integrated
- Central semantic model Integrated
- Native BI Integrated
- AI on governed data Integrated
- Governance and row-level security (RLS) Integrated
- Predictable cost through credits Integrated
- Everything in your language Integrated
- Data in Brazil (São Paulo region) Integrated
A comparison of integrated capabilities — no performance or cloud cost metrics. ingestia.io covers the BI core plus the data layer and AI that a BI-only tool doesn't deliver. Each feature's status appears next to it on this page.
The complete platform on every plan
BI, AI and pipelines from Starter up — plans change the scale, they don't hide the product. Usage credits are already included in the monthly fee.
Starter
Small business getting started with data
R$ 50/mo in included credits
- R$ 50/mo in included usage credits
- 3 data connections
- 1 BI creator user + 10 viewers
- Automated pipelines (Bronze, Silver and Gold)
- Full dashboards and visuals
- AI: ask your data
- Basic semantic model
Growth
Company centralizing multiple sources
R$ 150/mo in included credits
- R$ 150/mo in included usage credits
- 10 data connections
- 3 BI creators + 50 viewers
- Scheduled pipelines (Bronze, Silver and Gold)
- Full semantic model (measures and formulas)
- Row-level security (RLS)
- AI Analyst reports (basic)
Business
Professional data + BI operation
R$ 500/mo in included credits
- R$ 500/mo in included usage credits
- 30 data connections
- 10 BI creators + 200 viewers
- Sensitive data governance (PII)
- Data lineage and auditing
- Full AI Analyst reports
- Embedded dashboards
Scale
Mid-market / advanced operation
R$ 1.500/mo in included credits
- R$ 1,500/mo in included usage credits
- 100 data connections
- 25 BI creators + 1,000 viewers
- Everything in Business
- Bring your own cloud (BYOC) included
- Corporate SSO (limited access) and contractual SLA
- Assisted onboarding
Enterprise
Scale, security and a tailored contract
- Custom limits and credits
- Dedicated environment
- Bring your own cloud (BYOC)
- SLA and custom security
- Assisted onboarding
- Custom contract
Need more people in BI? Additional creator R$ 59/mo · +25 viewers R$ 79/mo · +100 viewers R$ 199/mo. See the full plan comparison →
Get started on your own, at your own pace
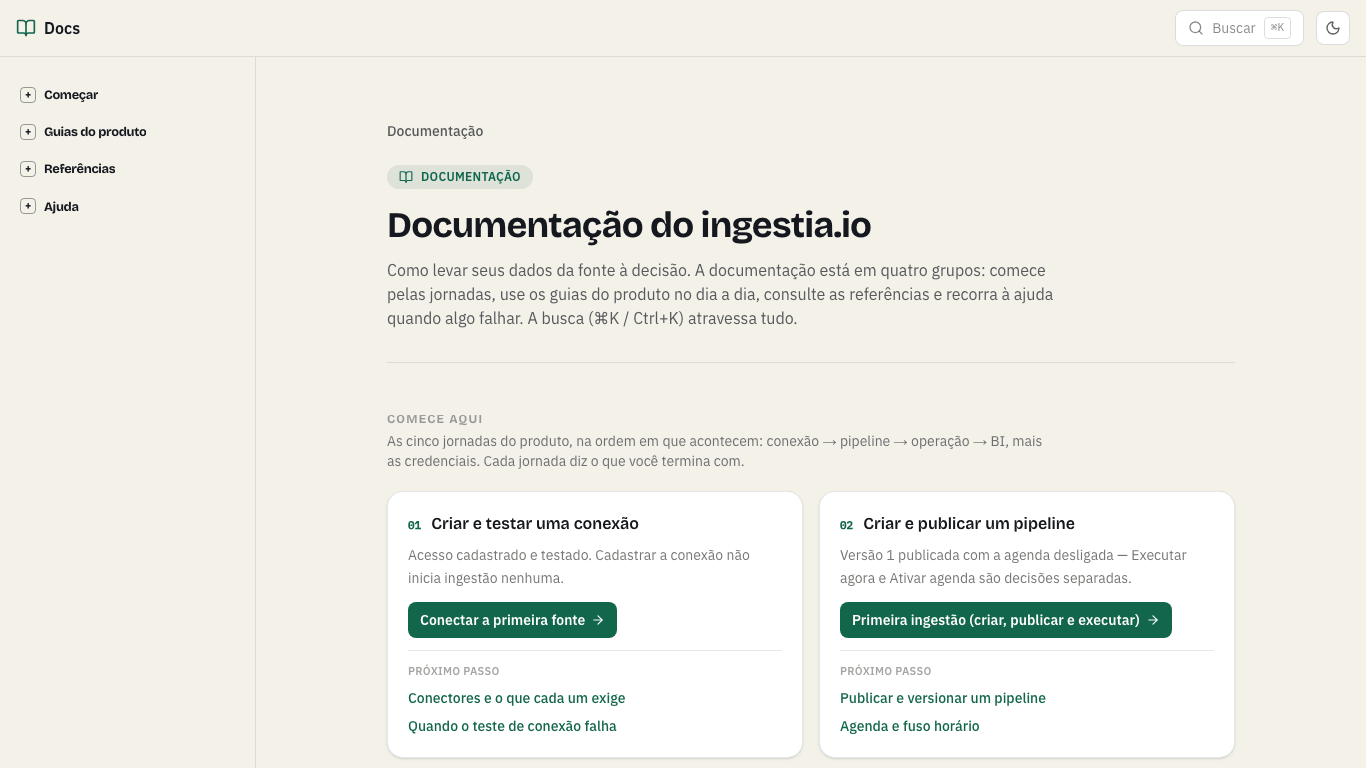
Guides by module, integrations and FAQs — plus the blog with practical content for anyone organizing their data.
ingestia.bi
BI, visuals, semantic model and RLS.
Ingestia AI
AI on governed data.
Connectors
Supported data sources.
Integrations
Power BI, Excel, APIs and OData.
FAQ
The most common questions before getting started.
Plans and pricing
Full plan comparison.
From the blog
What companies ask before getting started
What is ingestia.io?+
ingestia.io is a complete Data, BI and AI platform. It centralizes data from ERP, spreadsheets, finance, CRM, databases and internal systems, automates pipelines in Bronze, Silver and Gold layers, lets you build complete dashboards in the native BI and puts artificial intelligence to work analyzing your company's information — all in a single platform, without building an entire data engineering team.
Is ingestia.io a BI tool?+
Yes. ingestia.io includes a complete BI, integrated with the data platform: dashboards with dozens of visualization types, KPIs, matrices, maps, filters, drill, a semantic model with measures, row-level security (RLS), alerts, exports, public sharing and embedded dashboards. And if you already use Power BI, Looker Studio or Tableau, you can keep using them: the platform delivers ready-to-use datasets for those tools via read-only connection, API and OData.
Does ingestia.io replace Power BI?+
It doesn't have to. You have two paths: use the ingestia.io native BI, integrated with your data and AI, or keep Power BI connected to the datasets prepared by the platform via OData/API — in that case the Microsoft license remains the customer's responsibility. Many companies use both.
How does ingestia.io's AI work?+
The AI works on your company's already organized data. You ask in natural language ("which product had the biggest margin drop this month?") and it queries the data and answers with numbers and charts — this is available on every plan. The AI Analyst, which generates scheduled executive reports, insights from dashboards, alerts and anomaly detection, is available from the Growth plan up. AI model usage is metered, with a monthly cost cap per workspace; the queries the AI runs on your data consume credits like any other query.
Do I need to know how to code?+
Not to get started. There's a visual wizard to connect sources and transform data without code. For technical users, there's a SQL console with more freedom. You can level up at your team's pace.
Which sources can I connect?+
Available: databases (PostgreSQL, SQL Server, Oracle, MySQL, BigQuery), files (CSV, JSON, Parquet) and Google Sheets. Limited access (use under the condition described on the connector page): Meta Ads (Facebook e Instagram), Google Ads, Omie ERP, Bling ERP, Conta Azul, Tiny ERP, NF-e (SEFAZ), Salesforce, HubSpot, Azure Blob Storage. Planned (not usable yet): Amazon S3, Google Cloud Storage. The catalog at /conectores shows the status and condition of each source.
ERP, CRM, marketing and finance finally speaking the same language.
Connect your sources, build your dashboards and let the AI answer questions about your company — in one platform, starting at R$ 499/mo.