
The path your data travels
Seven stages between the source system and the decision. Click a stage to see the screen that runs it and the page that explains it.
The same architecture you see inside the product
Sources, ingestion, orchestration, a layered datalake and consumption — with governance across everything. Click any piece to see where it is explained.
Orchestration and scheduling
Decides WHEN each load runs, reruns what failed and logs everything.
drives block 2 (ETL/ELT) and the transformations in block 4 (Datalake)
Data sources
Systems where the data lives today.

ETL/ELT
Brings data from outside into your datalake.
Triggered by: DAGs (block 3)
Datalake
Storage and processing, in three layers.
Transformations triggered by the DAGs (block 3)
Consumption and intelligence
Where processed data becomes decisions.
A question in plain language becomes a query — with the source of each number in the answer.
AI AgentsAgents you build: they query your data, read your documents and suggest what to do — and only act after someone approves.
ReportsA finished report, written by the AI from your dashboards, delivered by email at the time you set.
Every piece is a link: it takes you to the site page or the documentation section that explains that part.
Dedicated datasets per workspace — nothing crosses between customers.
Estimate before running, charged afterwards — with a cap per query.
Runs, exports and personal data reveals are logged.
- 1
The source
The system where the data is born: ERP, CRM, database, spreadsheet, file or cloud service. Nothing is installed inside it — ingestia.io reads through the access you authorize.
Read the documentation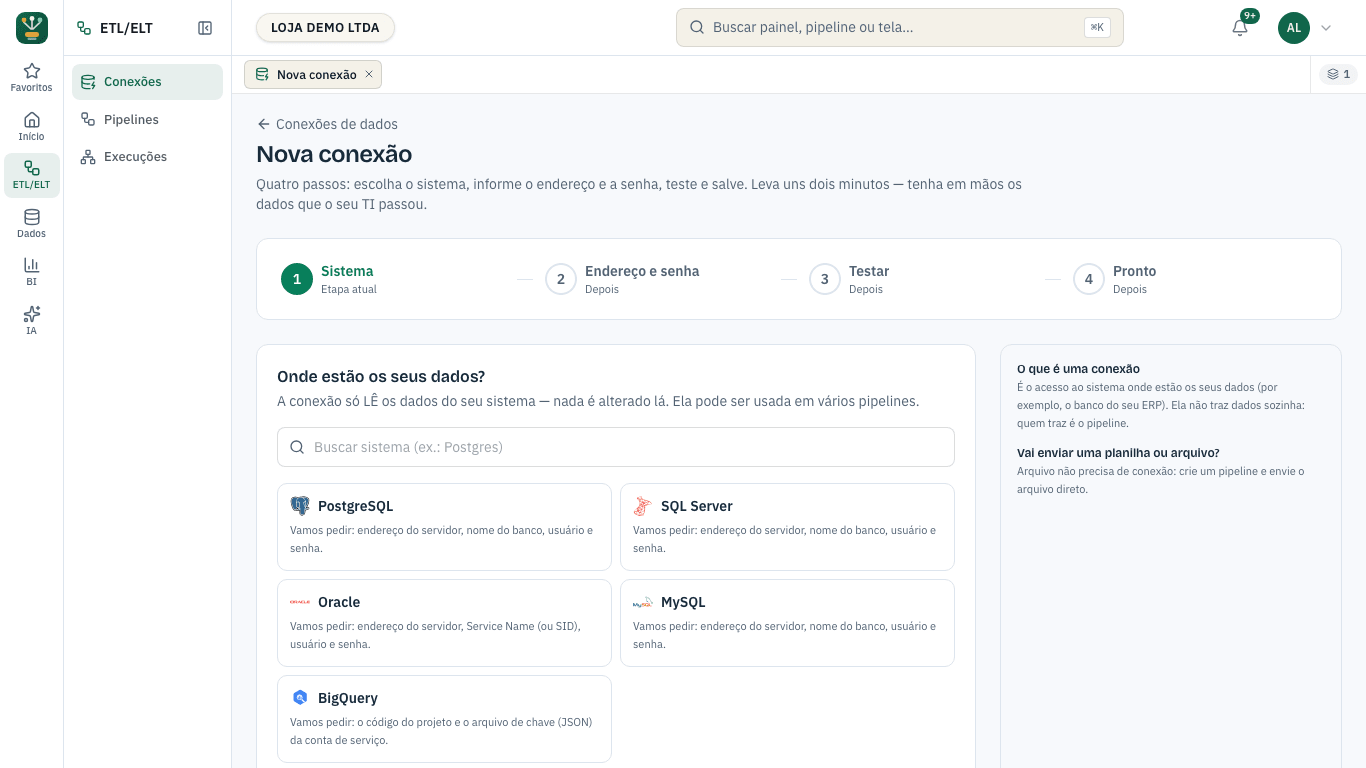
- 2
The connection
The credential is stored and tested before it counts. If the test fails, the connection does not go live — and the reason is written out.
Read the documentation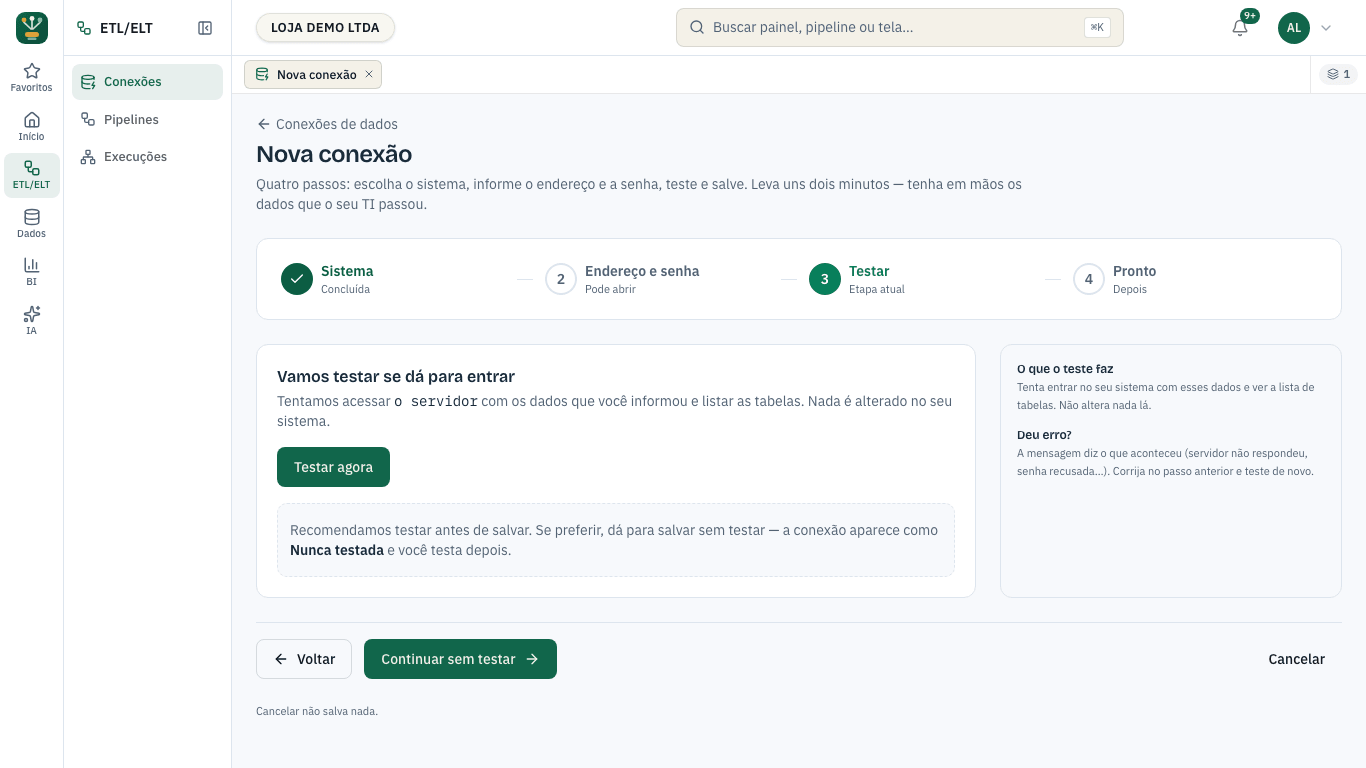
- 3
The scheduled load
You choose the frequency and the time. On every run the platform records what it brought in, how long it took and how much it cost.
Read the documentation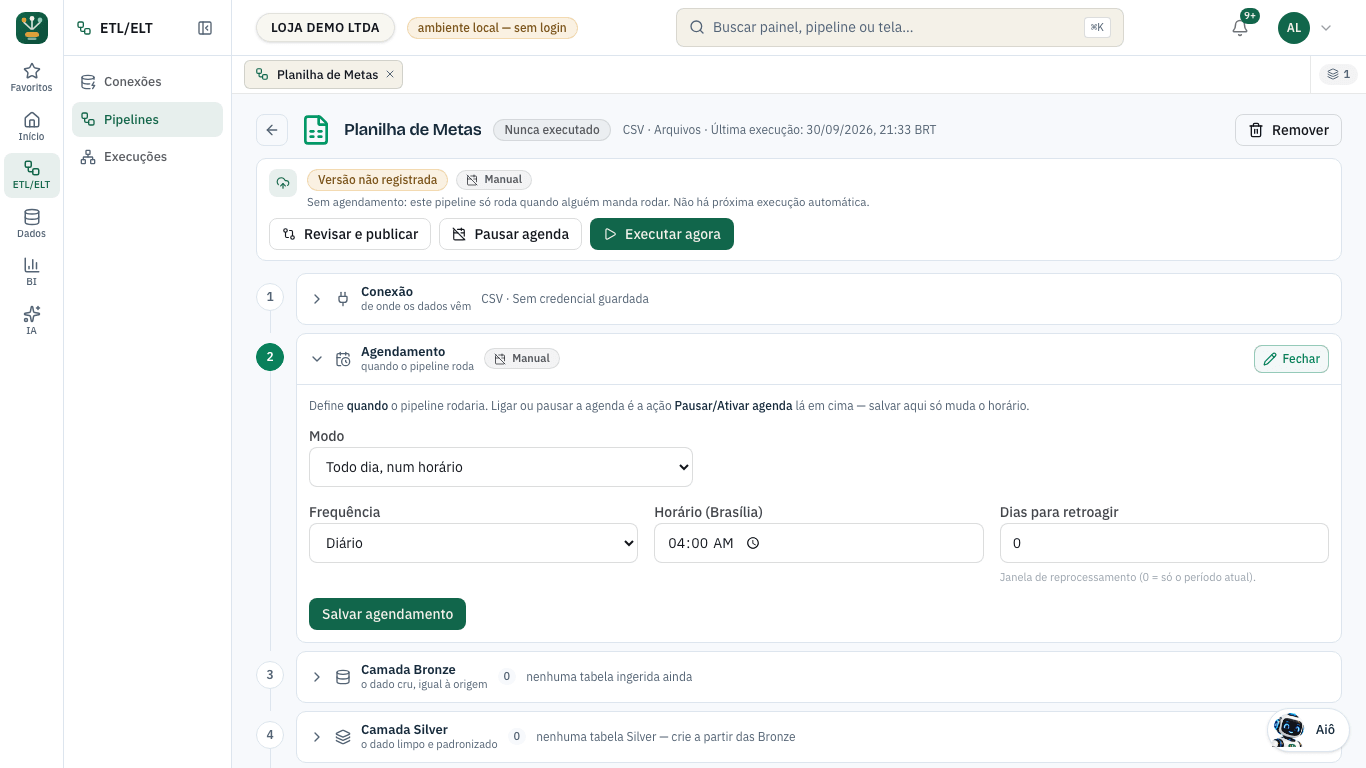
- 4
Bronze — the data as it arrived
A faithful copy of the source, with a date. It serves as proof: you can go back and check where each number came from, even months later.
Read the documentation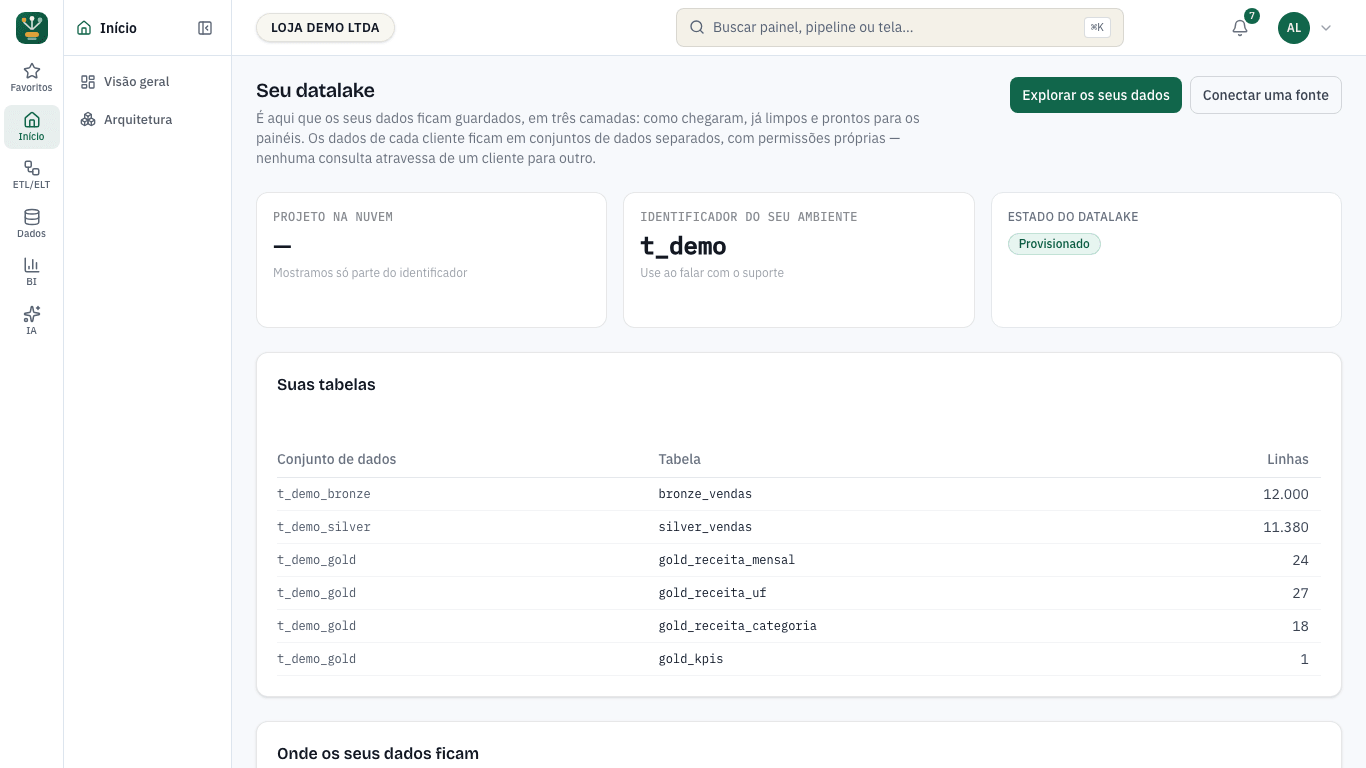
- 5
Silver — the data tidied up
Types fixed, names standardized, duplicates resolved, keys matched. This is where ERP and CRM start speaking the same language.
Read the documentation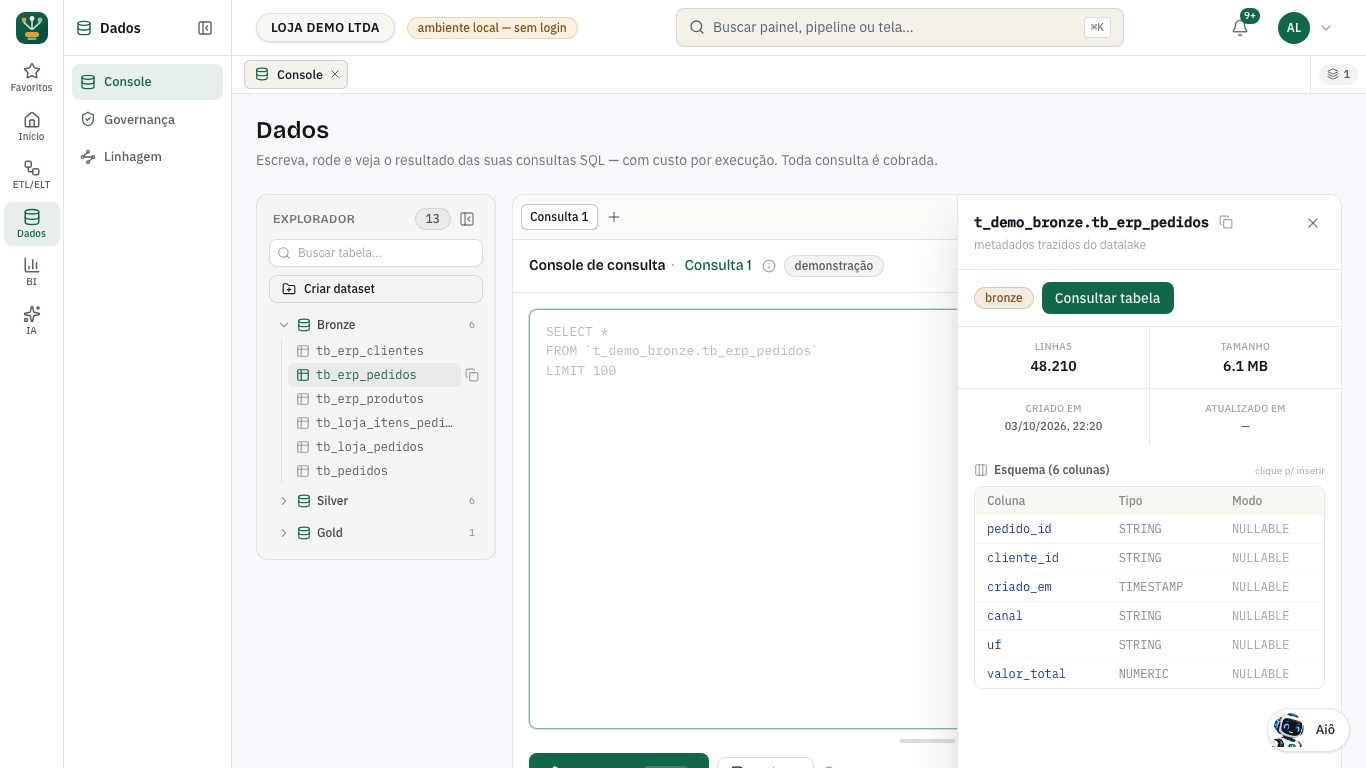
- 6
Gold — the data that answers
Tables shaped like the business question, with the measures already defined. BI and AI read from here, never from the source.
Read the documentation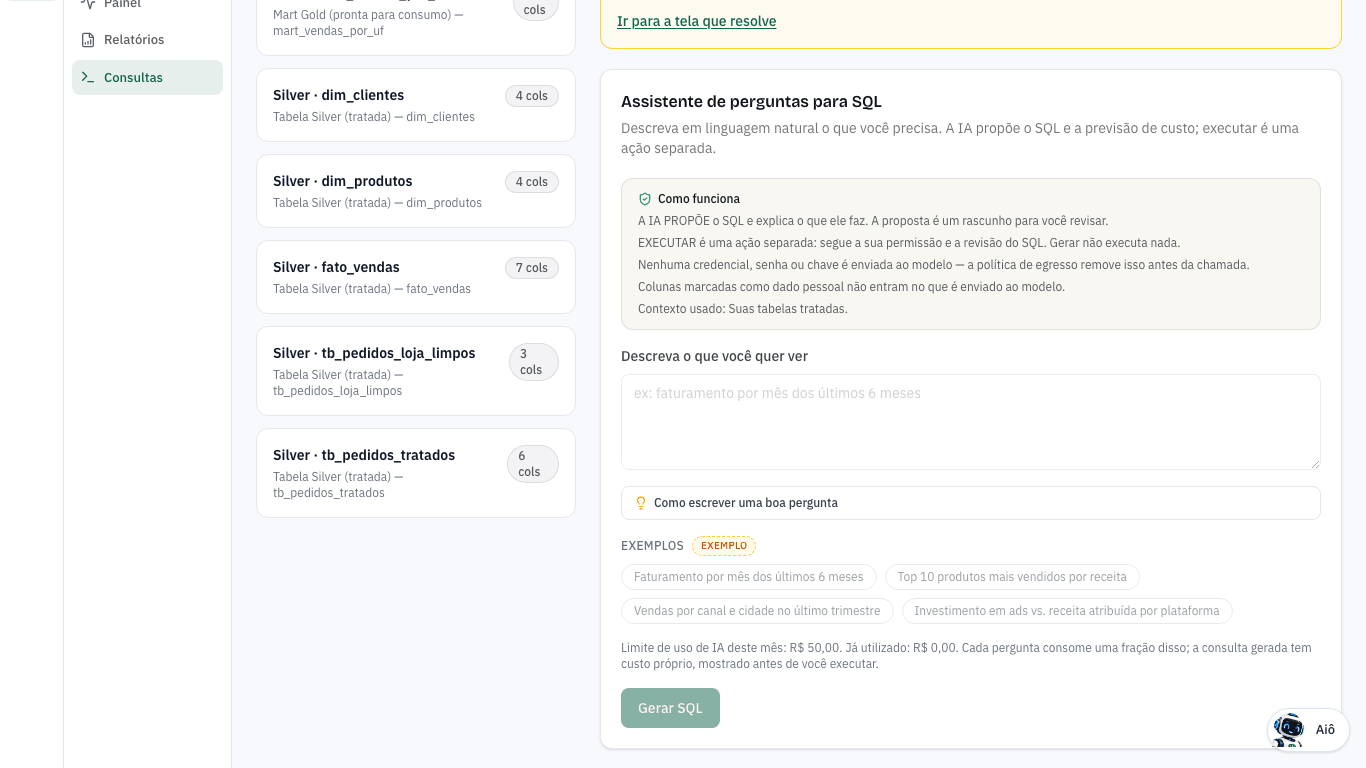
- 7
Consumption
Dashboards, questions in plain language, agents, Power BI, Excel and the API — all over the same Gold layer, with the same access control.
Read the documentation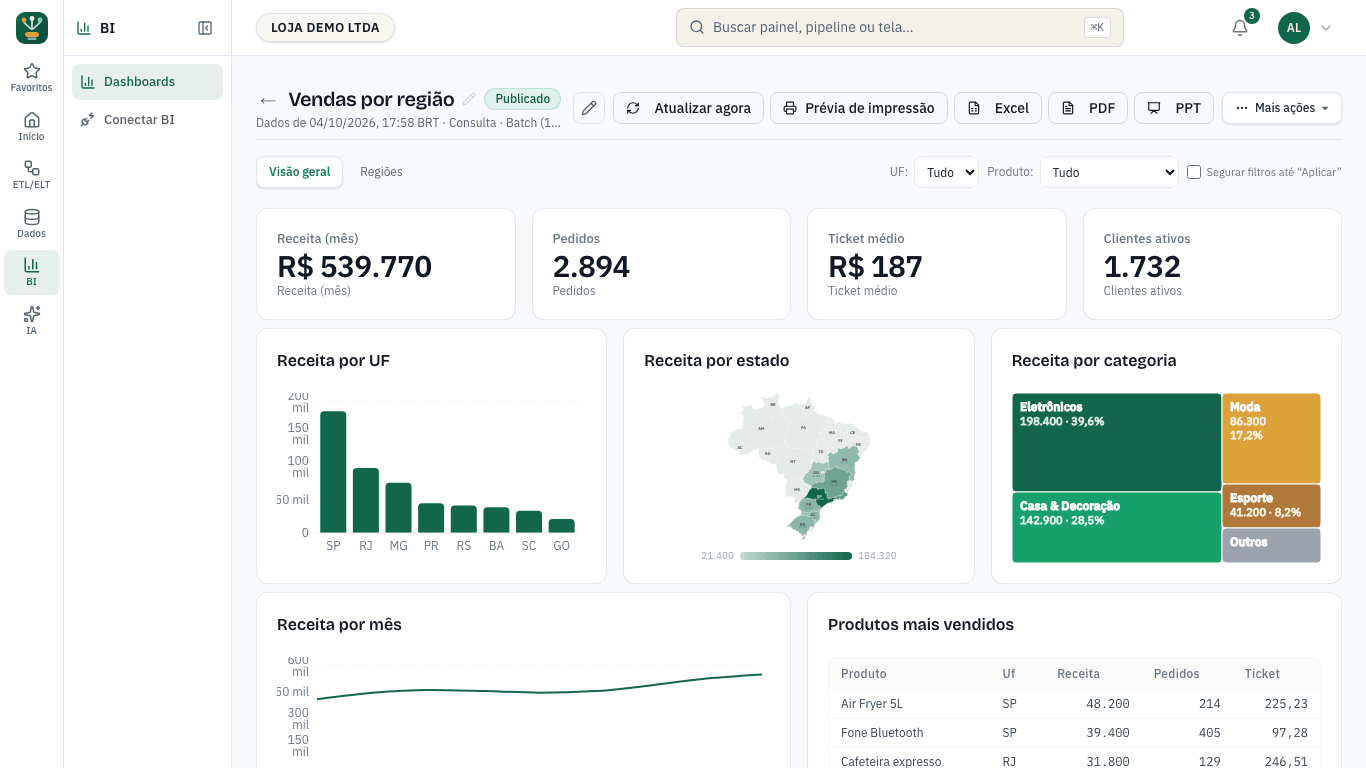
Fictitious demo data.
Google Cloud infrastructure in São Paulo
Every step above runs on a managed Google Cloud service, in Brazil. With your own cloud, it runs in your company's project.
Layers on BigQuery
Bronze, Silver and Gold in each customer's own datasets, isolated by the environment prefix.
Landing on Cloud Storage
Files and extracts arrive in an area exclusive to the environment before becoming tables.
Processing on Cloud Run
Loads run in on-demand containers. Notebooks run on Spark clusters you switch on and off.