Data pipelines: what they are and why you should automate ingestion
A data pipeline is the automated path that takes data from its source to a base ready for analysis. Learn the stages and why automating changes the game.
Every time someone exports a spreadsheet from the ERP, fixes the columns and pastes it into a report, they are running a data pipeline — just by hand. A pipeline is simply the path data travels from its source until it is ready to use. The difference between doing this manually and automating it is huge: time, consistency and trust.
What is a data pipeline
It is a sequence of steps that takes data from a source, transforms it into what you need and delivers it to a destination — all automatically and repeatably. Instead of relying on someone remembering to update the spreadsheet every Monday, the pipeline runs on its own, on schedule, the same way every time.
The three classic stages
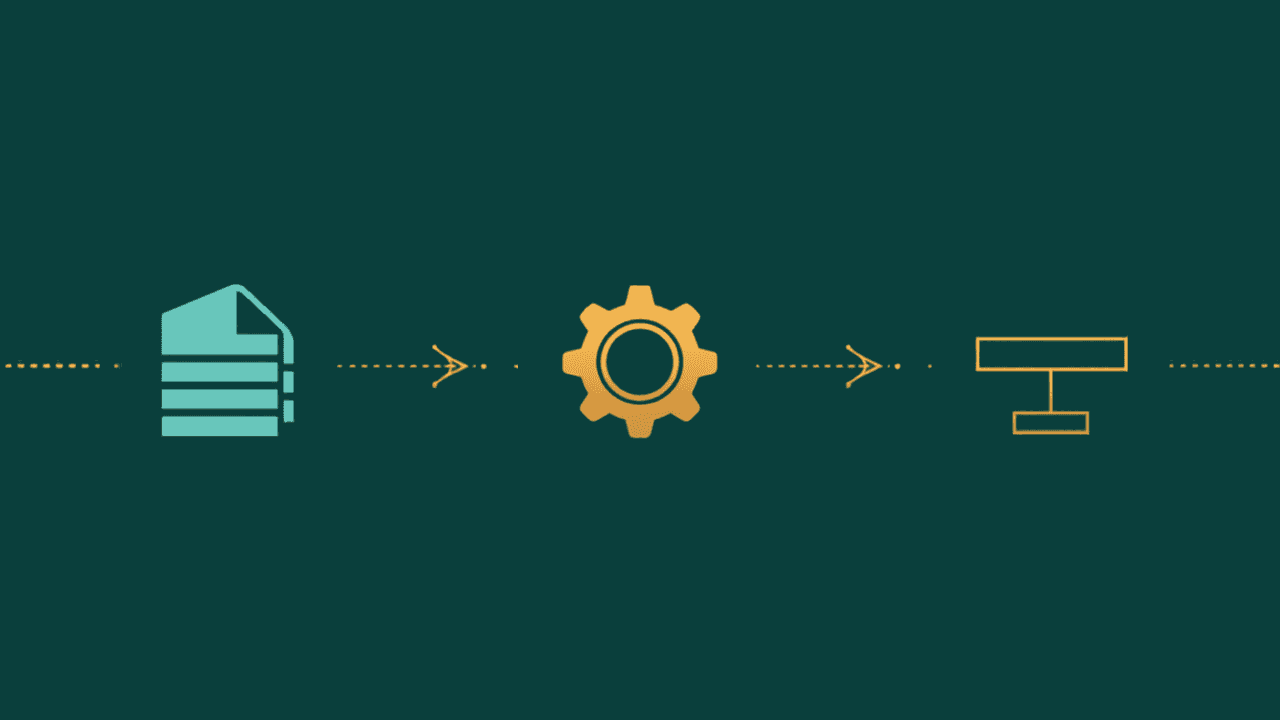
- Extract: read data from the source (database, ERP, file, API);
- Transform: clean, standardize and combine the data;
- Load: write the result to the destination, ready to use.
These stages are usually called ETL (or ELT, when the transformation happens inside the destination). The name matters less than the idea: data comes in raw and goes out organized, with no manual work on every cycle.
Why automate
A manual process works until the company grows. Then it becomes a bottleneck: it eats up hours, depends on specific people and piles up silent errors. Automating with pipelines solves all three problems at once — the information is ready on time, with the same logic every time, and people are free to interpret the data instead of assembling it.
Pipeline vs. one-off script
You can automate with one-off scripts, but they tend to become a patchwork that is hard to maintain: when one breaks, nobody knows why. A well-built pipeline has scheduling, run history, failure visibility and usage control — you can see what ran, when, how much it cost and where it failed.
When a run fails
Sources change, connections drop, formats break. The point is not to avoid 100% of failures, but to detect them quickly and know where to fix them. That is why monitoring is part of a good pipeline: it alerts you when something stops, instead of you finding out from a wrong report in a meeting.
How a platform like ingestia.io helps
In ingestia.io, pipelines have a visual area: you build extract, transform and load as connected steps, schedule the run and track history, failures and usage — without operating complex orchestration tools or writing the infrastructure behind them.
The goal is to give you the complete platform to move past scattered data: connect sources, organize them into Bronze, Silver and Gold layers, transform with a wizard or SQL, and consume the data wherever it makes sense — in the native BI (with dashboards, measures and alerts), by asking the AI in plain language, in AI Analyst reports, or via APIs, webhooks and external tools like Power BI and Excel. All on a monthly plan with usage credits, with consumption tracked in real time — and no data team required to get started.
Keep reading
Pages that go deeper into what you just read.
Does your company need to centralize data?
Take the ingestia.io Data Structure Simulator and find out which path makes the most sense to organize your sources, cut rework and build a reliable foundation for reports, dashboards and integrations.