Is your data scattered? Signs it's holding your company back
Decentralized data rarely shows up as a "data problem" — it shows up as rework, meetings to reconcile numbers and delayed decisions. Learn to spot the signs.

Few companies walk in saying "we have a data problem." What they feel is something else: slow reports, teams that disagree on numbers, an entire meeting spent figuring out which spreadsheet is right. These symptoms almost always share the same root — data is scattered across systems that don't talk to each other. Spotting the signs early keeps the problem from growing along with the company.
Sign 1: every team has a different number
Sales says revenue was X, finance says Y, leadership gets Z. It's not bad faith or incompetence: each team looks at a different system, with different rules and cuts. Sales counts orders; finance counts what was received; and nobody agreed on what counts as "revenue." When data is centralized and cleaned in a single source, everyone starts from the same place — and the debate stops being about which number is real.
Sign 2: reporting is manual work
If closing the monthly report means exporting spreadsheets, copying, pasting and checking formulas, the cost isn't just the time spent. It's the human error that slips through, the delayed decision and the skilled person stuck on a repetitive task. This work happens every month and rarely gets counted — but added up over a year, it's usually expensive.
Sign 3: everything depends on one person
There's always that one person who "knows where everything is" and can build any report. It looks like a strength, but it's a risk: when they go on vacation, get overloaded or leave the company, the information stalls with them. Centralizing data turns that individual knowledge into a company process that keeps working no matter who is around.
Sign 4: exports all the time
Exporting from the ERP, CRM and finance system every week is the most visible symptom of scattered data. Every export is a copy that starts going stale the moment it's made — a second later, the source has already changed. The ideal is the opposite: data flows on its own into a central place, refreshed as often as the business needs, with nobody clicking "export."
Sign 5: nobody trusts the dashboard
When the underlying data is unstable, the dashboard inherits the distrust. People look at it, but double-check "by hand" before deciding — which cancels out much of the value of having a dashboard. Trust in data doesn't come from a pretty chart; it comes from a centralized, consistent foundation behind it.
The hidden cost of not fixing it
The losses from keeping data scattered rarely appear as a budget line, but they're there:
- Recurring hours of skilled people building spreadsheets;
- Decisions made with outdated or conflicting data;
- Rework every time a source changes format;
- Missed opportunities because the information arrived late;
- Lack of trust in dashboards — and, with it, in decisions.
Where to start
The good news is you don't have to fix everything at once. Start by mapping the sources behind your most important decisions, centralize those first and automate one report that's currently done by hand. With one concrete win, it's easier to move on to the rest.
How a platform like ingestia.io helps
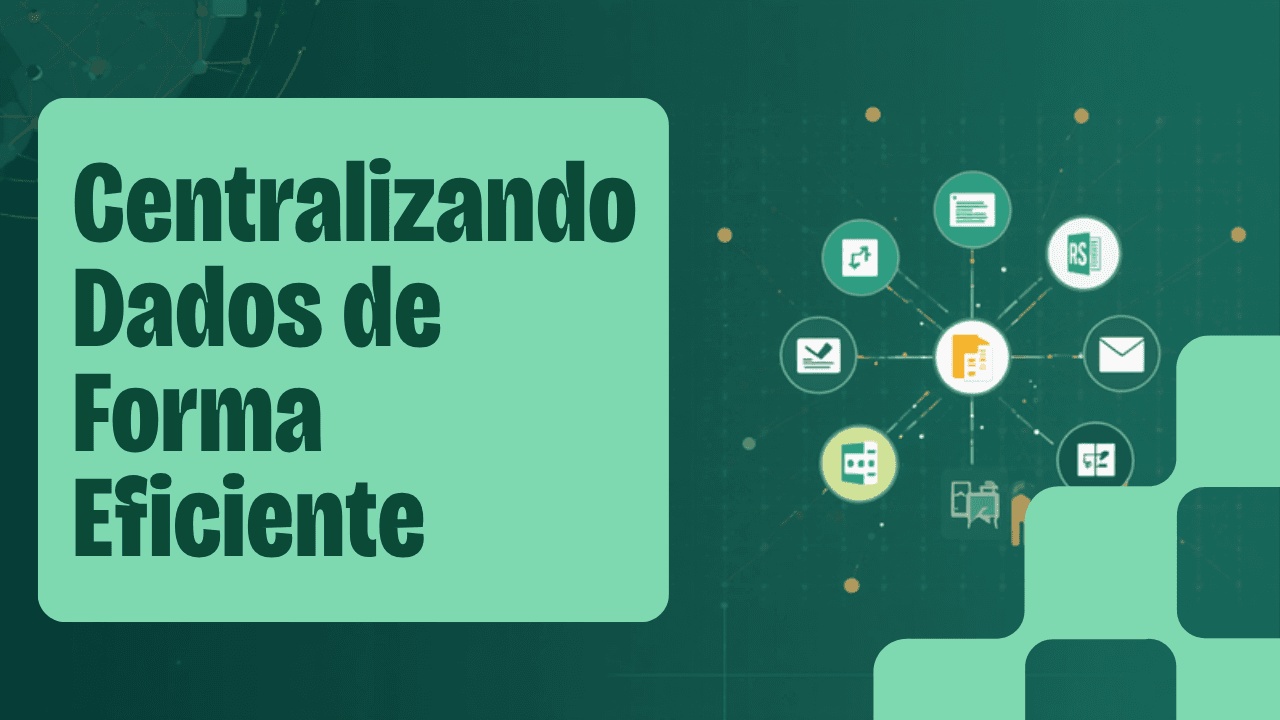
Centralizing is the first step, and that's where ingestia.io comes in: you connect your ERP, spreadsheets, finance system, CRM and databases to a single environment, set the refresh frequency, organize the data into layers and deliver a single source of truth for the whole company — cutting rework and disagreement between teams.
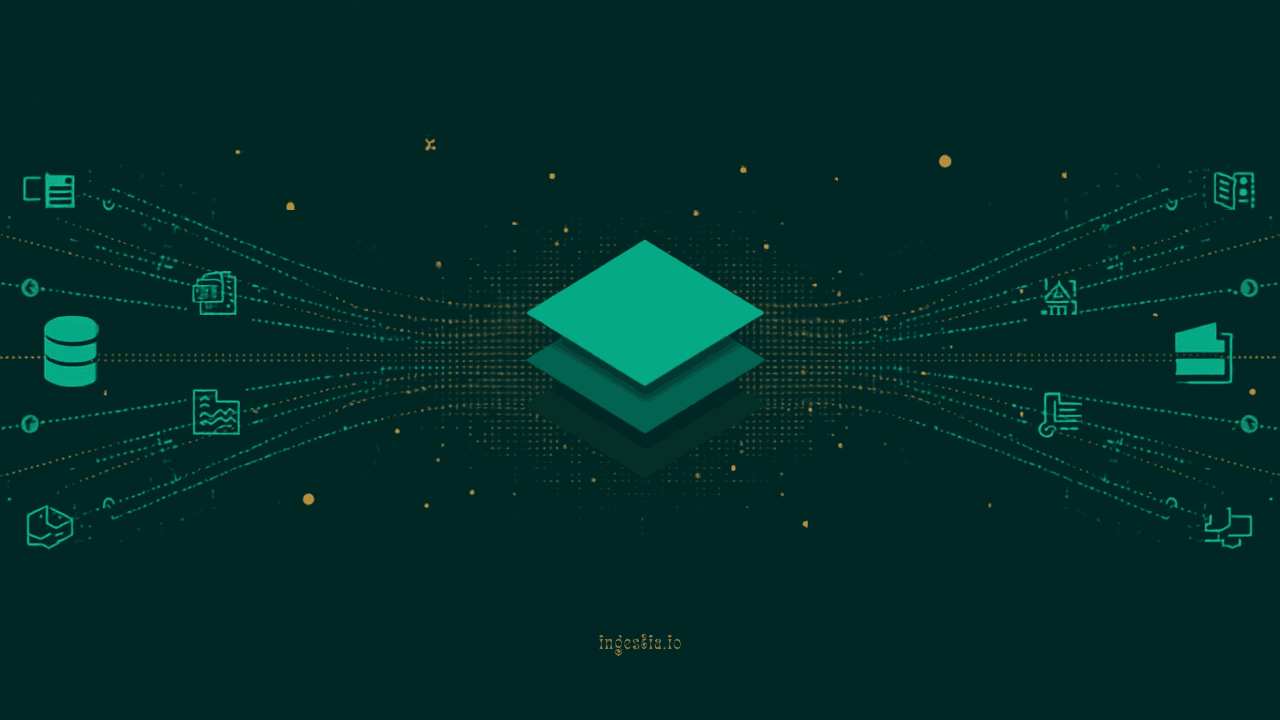
The goal is to deliver the complete platform for moving past scattered data: connect sources, organize them into Bronze, Silver and Gold layers, transform with a wizard or SQL, and use the data wherever it makes sense — in the native BI (with dashboards, measures and alerts), by asking the AI in plain language, in AI Analyst reports, or through APIs, webhooks and external tools like Power BI and Excel. All on a monthly plan with usage credits, consumption tracked in real time — and no data team required to get started.
Keep reading
Pages that go deeper into what you just read.
Does your company need to centralize data?
Take the ingestia.io Data Structure Simulator and find out which path makes the most sense to organize your sources, cut rework and build a reliable foundation for reports, dashboards and integrations.