Data lake vs. data warehouse vs. BI: what's the difference?
Data lakes, data warehouses and BI aren't competitors — they're steps on the same path. Learn what each one does without getting lost in the jargon.
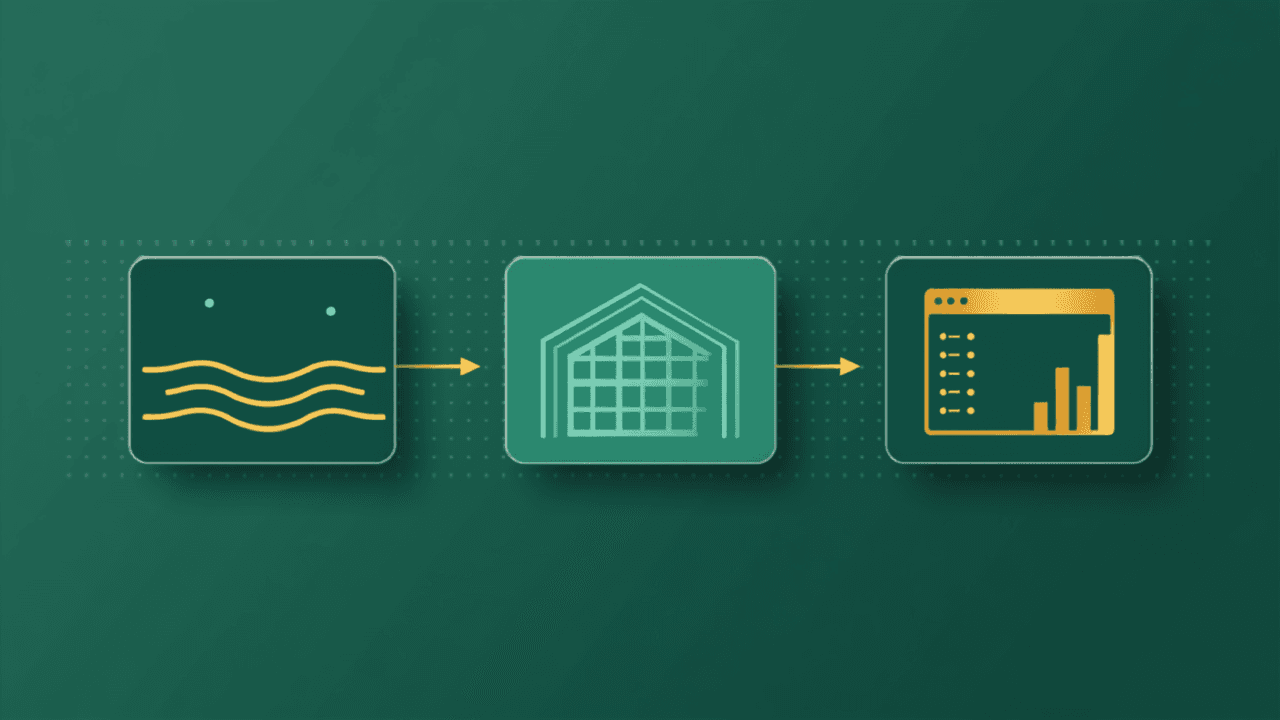
These three terms are often used as if they meant the same thing, or as if you had to pick just one. Both mistakes are expensive: they lead you to compare things that don't compete and to buy the wrong tool for the problem. In practice, a data lake, a data warehouse and BI solve different problems and, in most companies, work together as steps on the same path.
An analogy helps: think of a kitchen. The data lake is the pantry, where every raw ingredient arrives and gets stored. The data warehouse is the prep counter, with ingredients already washed, chopped and laid out in the right order. BI is the finished dish, plated and served. You need all three for the meal to come out right — in the right order.
Data lake: where everything lands
A data lake is the central repository that takes in data in any format — tables, files, exports. It's flexible and built to store a lot of varied data. It's the entry point, where raw and cleaned data live side by side in layers.
Data warehouse: where data is modeled for analysis
A data warehouse is more structured: it organizes data into models optimized for fast analytical queries. In modern architectures, the line between lake and warehouse is thin — the Gold layer of the datalake already plays much of that role.
BI: where data becomes decisions
BI tools — Power BI, Looker Studio, Tableau — are the visualization layer. They connect to the analytical base and turn tables into charts, dashboards and KPIs. BI is the storefront; it depends on everything that comes before it.
How they fit together
- Sources feed the data lake (Bronze and Silver layers);
- The Gold layer models the data for analysis (the warehouse role);
- BI connects to the Gold layer and displays the KPIs.
Do I need all three as separate products?
Not necessarily. In modern architectures, the lake and the warehouse fit in the same platform — the Gold layer already delivers the modeled data that BI consumes. What matters isn't collecting tools, but covering the three roles: ingest and store (lake), organize for analysis (warehouse/Gold) and visualize (BI). A small company can have all of this in a single flow, without three separate systems to maintain.
And the third role fits in the same platform too: ingestia.io includes native BI — dashboards, measures, alerts and row-level access control — and AI that answers questions in plain language about your cleaned data. In other words, all three roles (lake, warehouse and BI) can live in a single product; an external BI tool becomes an option for teams that already use one, not a requirement.
The common mistake
Starting with BI without a lake or any modeling behind it. The dashboard does show up, but it rests on unstable exports and soon loses people's trust. The order that works is always the same: centralize, organize, and only then visualize.
How a platform like ingestia.io helps
ingestia.io brings all three roles into one platform: you ingest, organize into Bronze, Silver and Gold, and visualize in the native BI — or deliver a ready Gold layer to the BI tool your company already uses. Instead of building and maintaining three separate systems, you run one flow.
The goal is to deliver the complete platform for moving past scattered data: connect sources, organize them into Bronze, Silver and Gold layers, transform with a wizard or SQL, and consume the data wherever it makes sense — in the native BI (with dashboards, measures and alerts), by asking the AI in plain language, in AI Analyst reports, or through APIs, webhooks and external tools like Power BI and Excel. All on a monthly plan with usage credits, with consumption tracked in real time — and no data team required to get started.
Keep reading
Pages that go deeper into what you just read.
Does your company need to centralize data?
Take the ingestia.io Data Structure Simulator and find out which path makes the most sense to organize your sources, cut rework and build a reliable foundation for reports, dashboards and integrations.