How to prepare data for Power BI, Looker Studio and Tableau
A great dashboard starts with the data behind it. Here's how to prepare your data so Power BI, Looker Studio and Tableau can shine.

Anyone who uses Power BI, Looker Studio or Tableau quickly learns one truth: the hard part is rarely the chart. Building a good-looking visual takes minutes. The real work is making sure the data reaching the tool is complete, consistent and up to date. A well-prepared base is what separates a dashboard everyone trusts from one nobody opens.
Connect to the right layer
Instead of pointing BI at exports or spreadsheets that keep changing, connect it to a layer modeled for consumption (the Gold layer). That way, the dashboard always reads from a stable, clean base.
Standardize before you display
- Unify customer, product and region names;
- Standardize dates, currencies and units;
- Resolve duplicates and inconsistent records;
- Precompute KPIs that repeat across multiple dashboards.
Think about performance
Slow dashboards are usually a symptom of poorly prepared data — the tool tries to process on the fly what should already be ready. Delivering modeled tables reduces BI's workload and makes dashboards load faster.
Use read-only connections
For BI, the ideal is a read-only connection scoped to the right data. That protects the base and keeps control over who sees what — important when sensitive data is involved.
One source, many tools
A practical upside of preparing the base properly: the same clean data can feed Power BI, Looker Studio and Tableau at the same time, with no conflicting versions. If the company switches BI tools tomorrow, the base stays the same — you don't start from scratch. It also avoids the common scenario where each team builds its own 'truth' in a different tool.
A flow that works
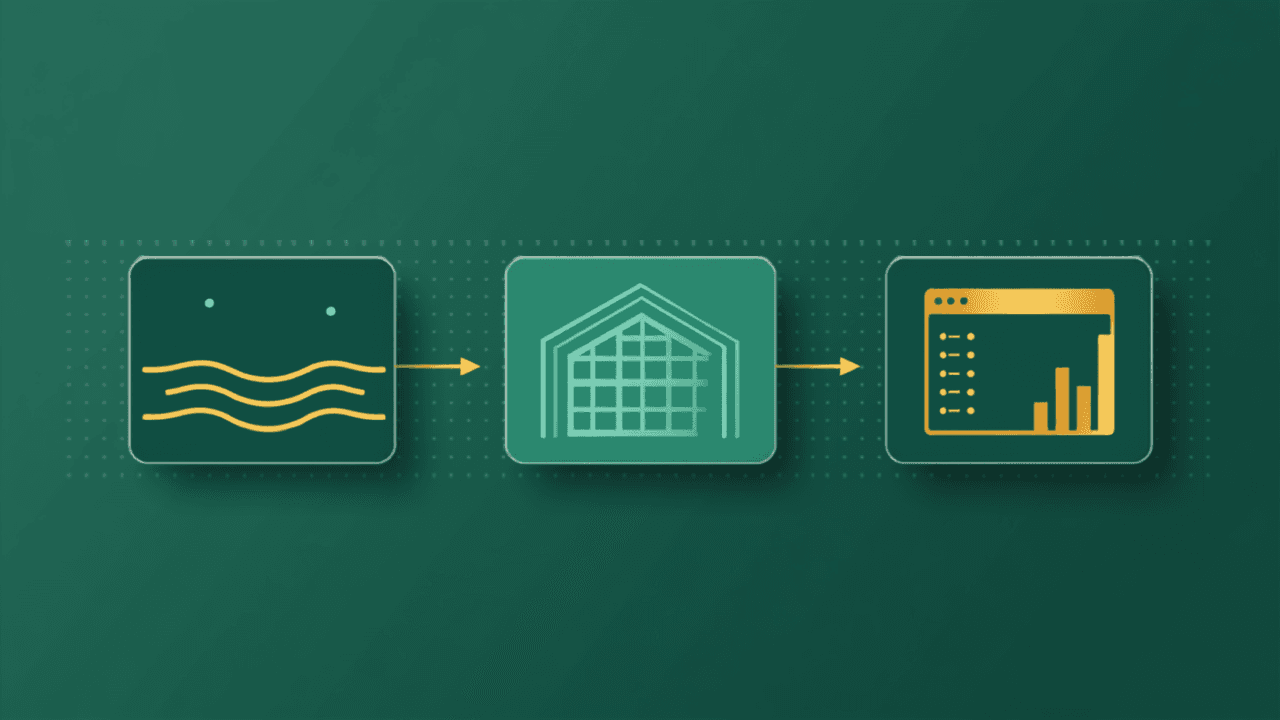
To sum up the path: centralize your sources, clean the data in the Silver layer, model KPIs in the Gold layer, and connect Power BI, Looker Studio or Tableau to that layer. The same clean data then feeds every tool — fast, consistent, and with no rework for each new dashboard.
What if you don't want an external tool?
Preparing the base is still the essential step — but today there's a shortcut: ingestia.io has native BI built into the platform, reading straight from the Gold layer, with dozens of visuals, centralized measures, alerts and plain-language AI. Already using Power BI? Keep using it — that's what the read-only connection is for. The difference is that choosing the tool is now up to you, not a dependency.
How a platform like ingestia.io helps
ingestia.io delivers data ready for Power BI, Looker Studio and Tableau, with a read-only connection scoped to your environment — and includes native BI with AI for teams that want to do everything in one place. You clean the data once and use it in any tool, always from the same trusted base.
The goal is to deliver the complete platform for moving past scattered data: connect sources, organize them into Bronze, Silver and Gold layers, transform with a wizard or SQL, and consume the data wherever it makes sense — in the native BI (with dashboards, measures and alerts), by asking the AI in plain language, in AI Analyst reports, or through APIs, webhooks and external tools like Power BI and Excel. All on a monthly plan with usage credits, with consumption tracked in real time — and no data team required to get started.
Keep reading
Pages that go deeper into what you just read.
Does your company need to centralize data?
Take the ingestia.io Data Structure Simulator and find out which path makes the most sense to organize your sources, cut rework and build a reliable foundation for reports, dashboards and integrations.